
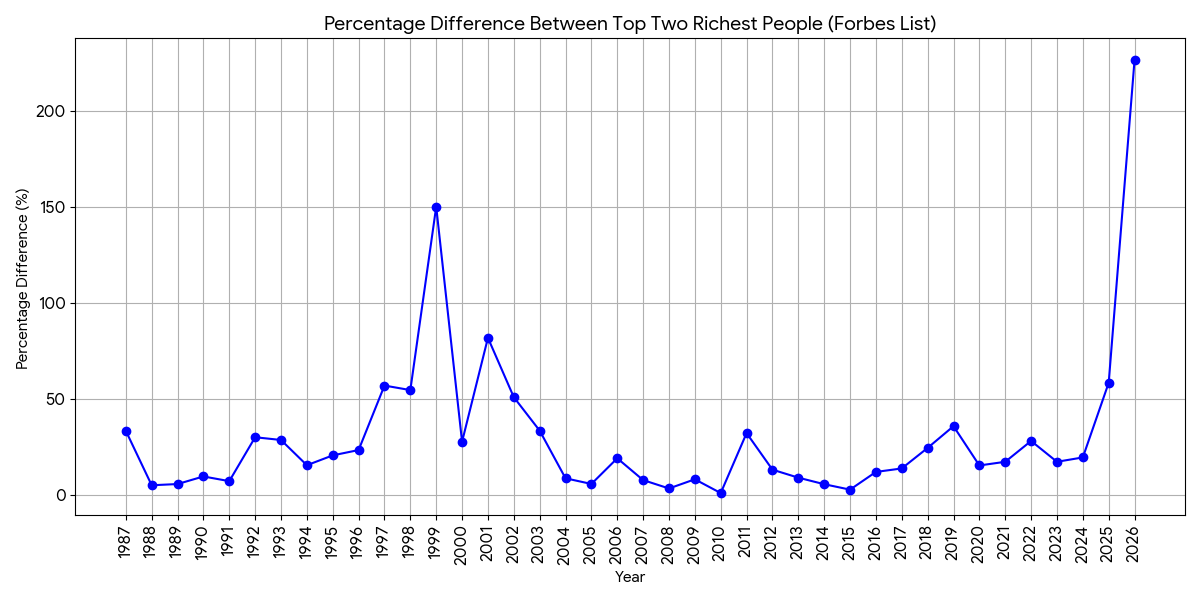
So I have been curious about the wealth gap between just the two richest folks because it feels to me like the differences are expanding all over even at the extremes. I did this with gemini to so take it with as much a grain of salt as you might like but its a relatively straight forward if tedius task so Im relatively confident it can do it right. Anyway I expected a long term increase over the millenia but instead I see an interesting artificat with today and the dot com bubble. Whats really scary is gates could be seen as a central figure in the bubble and tech to some degree but musk isn’t exactly at the center of ai as much as the center of both corporate and government corruption but maybe someone will have another take on that. So the dot com bubble was merely corporate collapse but if this is indicative of a collapse I do believe it will be along more lines.
I did this with gemini to so…
I haven’t got any experience with, or any paid access to, these LLM things.
Can you get Gemini to give you the figures (since there are only two for each year) and a URL source for those figures, along with the chart? I’m just thinking the output could be specified in a way that made it easy to double-check, and that could be an education, however double-checking turns out.
yeah it gives the reference which is actually forbes which I specified for it to use. I just did not double check but one thing that got me thinking of it was an article about the 2026 difference which is correct for march 10th but its early in the year so these values are estimates based on what happened in the first 3 months. Still the year before is above that 50% line. As I said grain of salt.
Eventually billionaires are going to be poor compared to the kaljillionares. Suckers.